Share this

Introduction to Dow Theory: Fundamental Theory of Technical Investing
Dow Theory, developed by Charles Henry Dow over a century ago, remains a timeless concept in technical analysis by providing a framework for understanding price trends. This theory comprises six key principles:
- Prices Discount Everything: Dow Theory explains that all factors affecting the market, including fundamentals, news, events, and market sentiments, are already reflected in the price. Therefore, technical analysts believe that they should trade based on what the charts are showing, rather than personal opinions or biases.
- Market Indexes Must Confirm Each Other: Various factors used in trading analysis, such as macroeconomic factors, economic indicators, and specific asset fundamentals, as well as technical analysis, can all be used together for profit opportunities.
- Volume Must Confirm The Trend: Volume, or the trading activity, helps confirm whether a price trend is supported by market participants or controlled by a few. A stable price trend typically needs substantial trading volume to support it. If the volume is low, the price movement may be temporary.
- Trends exist until definitive signals prove that they have ended: Prices can trend upwards, downwards, or even sideways. As long as a trend persists, traders can continue to hold the asset. However, if the trend reverses, it’s crucial to react accordingly.
- Market Trends Have Three Time Frames: Markets move through three main trends: the primary trend (lasting 1-3 years or more), the intermediate trend (lasting 3 weeks to 3 months, or more), and the minor trend (daily, monthly, or longer). Understanding these trends will help you plan your investments accordingly.
- Market Trends Have Three Phases: These phases include the accumulation phase, where the general public is not very interested; the public participation phase, where more investors start to buy in; and the distribution phase, where the early investors start to sell.
Understanding these principles is crucial for traders, as they form the foundation of technical analysis and guide trading strategies.
Share this
Subscribe by email
ภาษีคริปโตในไทย 2569: ทุกสิ่งที่นักลงทุนบน Exchange ที่ได้รับใบอนุญาตต้องรู้

ภาษีคริปโตในไทย 2569: ทุกสิ่งที่นักลงทุนบน Exchange ที่ได้รับใบอนุญาตต้องรู้
22 เม.ย. 2026, 13:39:26
2
min read
Thailand Bitcoin ETF: ทุกสิ่งที่นักลงทุนไทยต้องรู้ในปี 2569

Thailand Bitcoin ETF: ทุกสิ่งที่นักลงทุนไทยต้องรู้ในปี 2569
22 เม.ย. 2026, 10:03:40
3
min read
BTC ยังมีแรงซื้อ ท่ามกลางน้ำมันราคาพุ่ง
BTC ยังมีแรงซื้อ ท่ามกลางน้ำมันราคาพุ่ง
31 มี.ค. 2026, 13:33:49
2
min read
SEC สหรัฐเคาะ คริปโตส่วนใหญ่ไม่ใช่หลักทรัพย์
SEC สหรัฐเคาะ คริปโตส่วนใหญ่ไม่ใช่หลักทรัพย์
26 มี.ค. 2026, 11:33:09
2
min read
ทำความรู้จักเหรียญ IOST Coin เหรียญ เทคโนโลยีล้ำ บนโลก Web3 (Clone)

ทำความรู้จักเหรียญ IOST Coin เหรียญ เทคโนโลยีล้ำ บนโลก Web3 (Clone)
18 มี.ค. 2026, 20:17:42
2
min read
ประกาศสำคัญ: การปรับปรุงและอัปเดตรายการสินทรัพย์ดิจิทัลบางรายการ

ประกาศสำคัญ: การปรับปรุงและอัปเดตรายการสินทรัพย์ดิจิทัลบางรายการ
17 มี.ค. 2026, 16:00:45
1
min read
กองทุนแห่งชาติ UAE ลงทุน Bitcoin ผ่าน ETF เพิ่มขึ้น

กองทุนแห่งชาติ UAE ลงทุน Bitcoin ผ่าน ETF เพิ่มขึ้น
25 ก.พ. 2026, 14:14:49
2
min read
SSF คืออะไร อัปเดตเงื่อนไขล่าสุด พร้อมกลยุทธ์ลงทุนลดหย่อนภาษีให้คุ้มค่า
SSF คืออะไร อัปเดตเงื่อนไขล่าสุด พร้อมกลยุทธ์ลงทุนลดหย่อนภาษีให้คุ้มค่า
19 ก.พ. 2026, 14:45:00
2
min read
แนวรับ แนวต้าน คืออะไร? เทคนิคดูกราฟราคาสำหรับนักเทรดมือใหม่
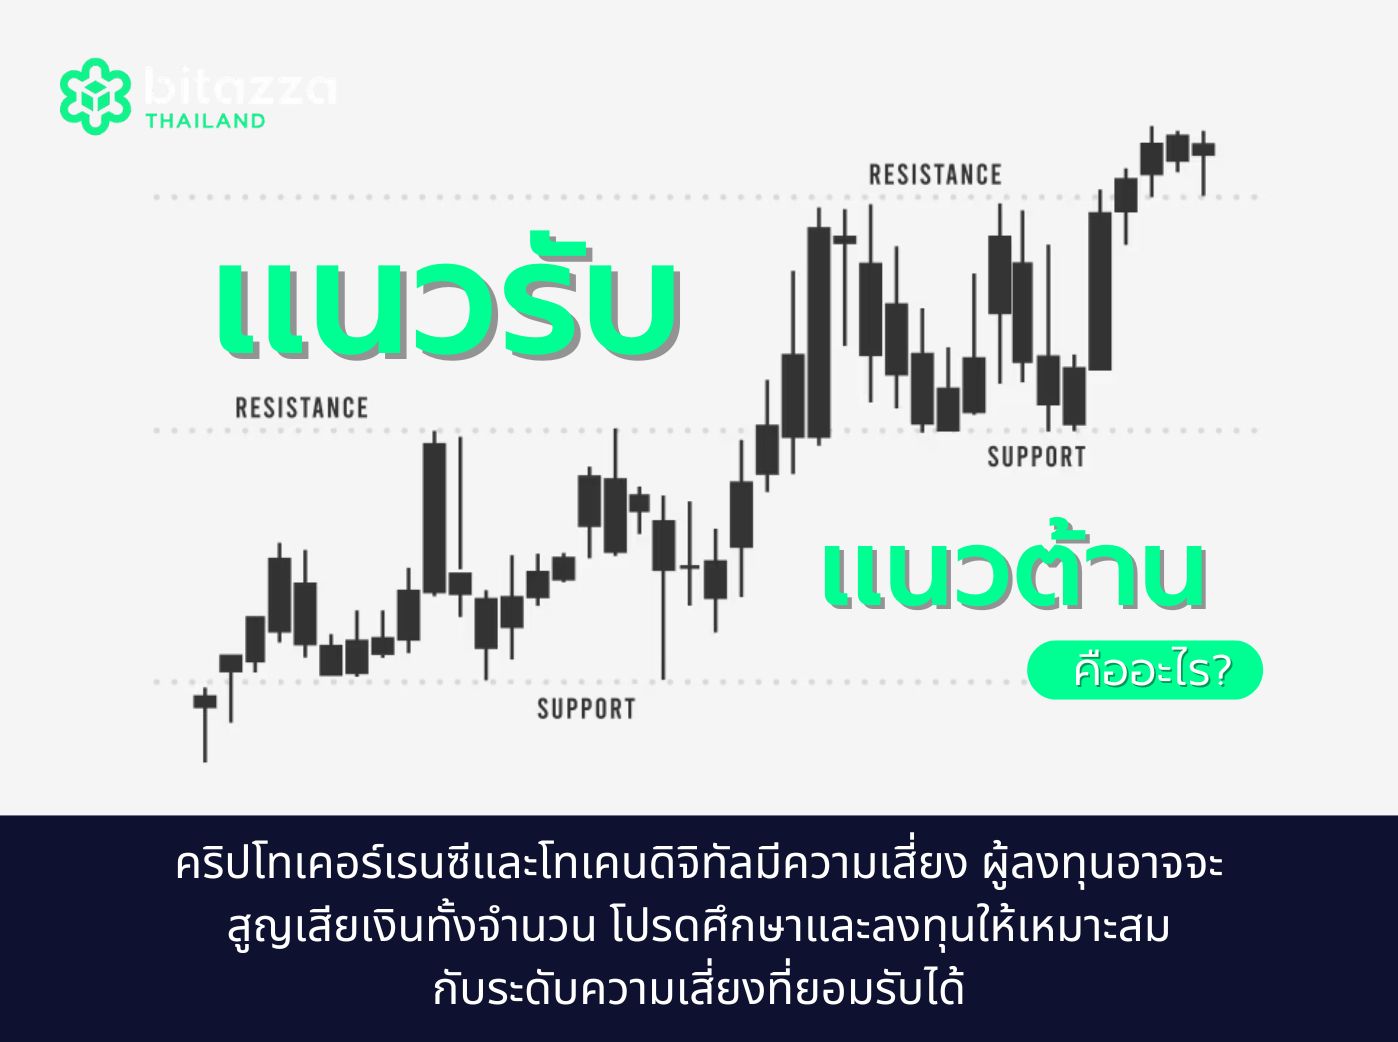
แนวรับ แนวต้าน คืออะไร? เทคนิคดูกราฟราคาสำหรับนักเทรดมือใหม่
19 ก.พ. 2026, 11:30:00
2
min read
Fibonacci คืออะไร เครื่องมือวิเคราะห์กราฟที่นักลงทุนคริปโตนิยมใช้
Fibonacci คืออะไร เครื่องมือวิเคราะห์กราฟที่นักลงทุนคริปโตนิยมใช้
19 ก.พ. 2026, 11:15:00
2
min read