Share this

Traders wanting to improve their trading skills should keep track of their trade results, analyze the statistics provided, and learn from mistakes. The important statistics that need to be analyzed include:
Return on Investment for each time period
Actual profit and loss, or Profit and Loss (PnL), is the best indicator of trading ability. However, traders should record profits and losses over different time periods, such as weekly, monthly, and yearly, as well as averaging returns on investments (ROI) in the long term to measure their ability to trade consistently. Making a high profit in a short period of time does not necessarily mean that they have the ability to maintain profitability in the long run.
Returns compared to the overall market
Another indicator of trading ability is to compare our returns with the overall cryptocurrency market. If we can outperform the market during a certain period, it means that we have a higher average value than other traders. Generally, the returns of Bitcoin are used as a benchmark for comparison.
Win Rate compared to the number of losses
In addition to achieving the highest possible returns, it is important to trade with a higher win rate than the number of losses. This demonstrates the accuracy of selecting coins to buy, as well as the use of technical analysis in making trading decisions. For example, if you make 10 trades, with 8 profitable trades and 2 losing trades, your win rate to losses is 80%, which is considered high. A good win rate should be above 50%.
Number of trades and holding period
The number of trades is an indicator of our trading behavior, whether with a short-term trading strategy or a long-term profit-oriented strategy. If there are frequent trading orders, the risk increases. Therefore, discipline in trading is necessary. While fewer trading orders indicate high-profit behavior. Similarly, the holding period of coins in the portfolio is an indicator of the trading style of each person, whether a day trader or a swing trader, which will lead to different trading approaches.
Analyzing trading results is like doing a self-audit to review our mistakes and learn from them. If you want to develop yourself further, you need to record and analyze your trading results every time.
Share this
Subscribe by email

ภาษีคริปโตในไทย 2569: ทุกสิ่งที่นักลงทุนบน Exchange ที่ได้รับใบอนุญาตต้องรู้

Thailand Bitcoin ETF: ทุกสิ่งที่นักลงทุนไทยต้องรู้ในปี 2569

BTC ยังมีแรงซื้อ ท่ามกลางน้ำมันราคาพุ่ง

SEC สหรัฐเคาะ คริปโตส่วนใหญ่ไม่ใช่หลักทรัพย์

ทำความรู้จักเหรียญ IOST Coin เหรียญ เทคโนโลยีล้ำ บนโลก Web3 (Clone)

ประกาศสำคัญ: การปรับปรุงและอัปเดตรายการสินทรัพย์ดิจิทัลบางรายการ

กองทุนแห่งชาติ UAE ลงทุน Bitcoin ผ่าน ETF เพิ่มขึ้น

SSF คืออะไร อัปเดตเงื่อนไขล่าสุด พร้อมกลยุทธ์ลงทุนลดหย่อนภาษีให้คุ้มค่า
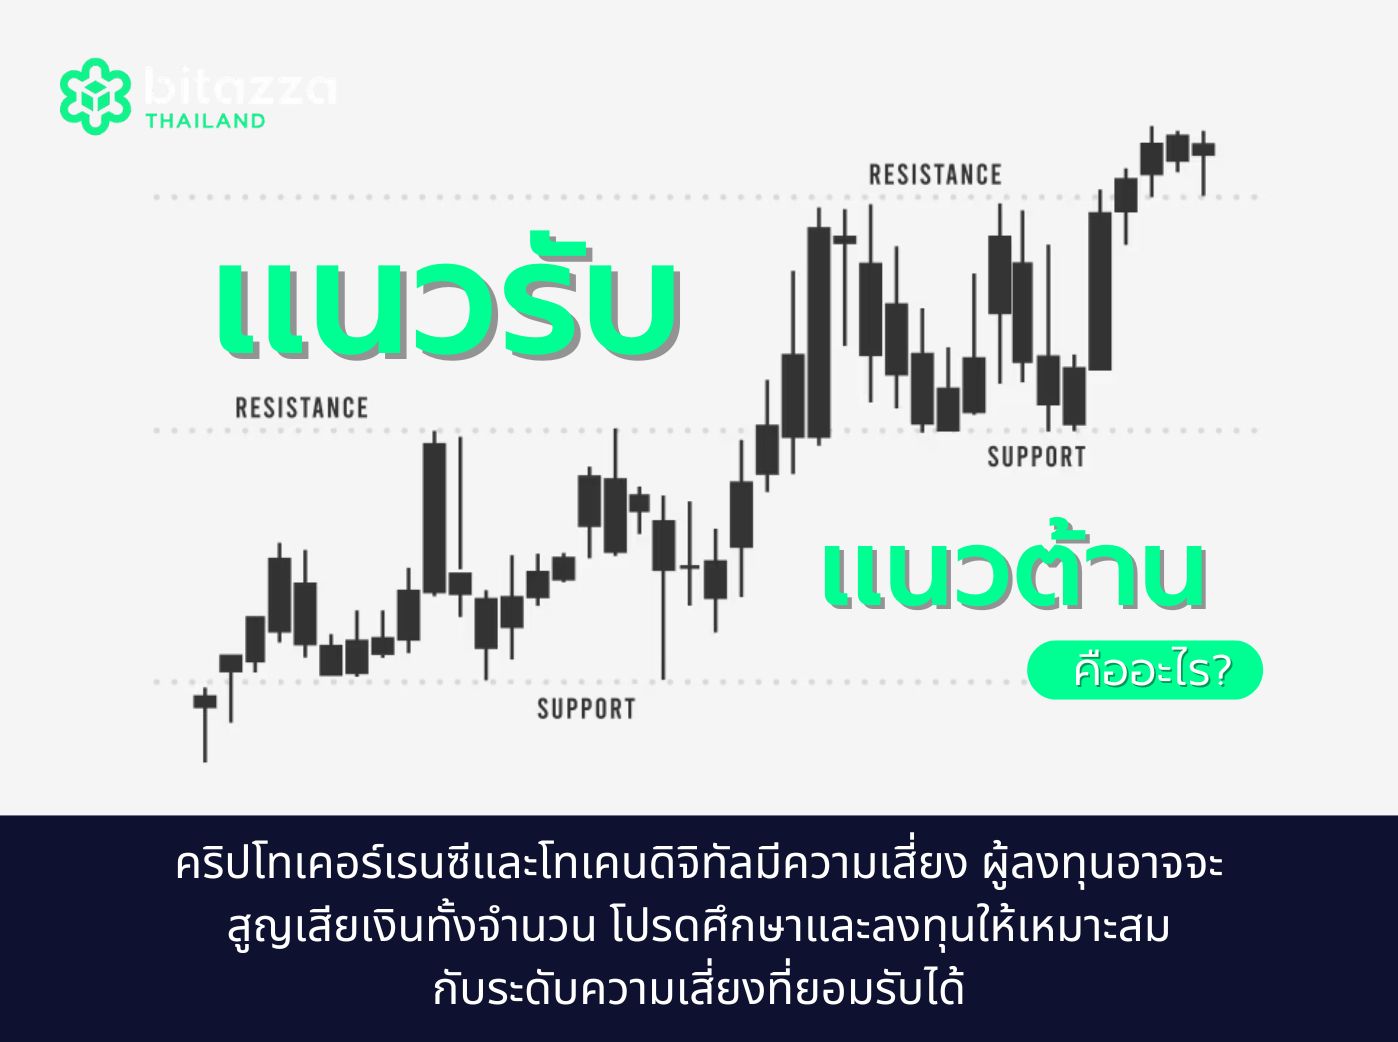
แนวรับ แนวต้าน คืออะไร? เทคนิคดูกราฟราคาสำหรับนักเทรดมือใหม่